Tell us what you're building. We'll come back with a plan.
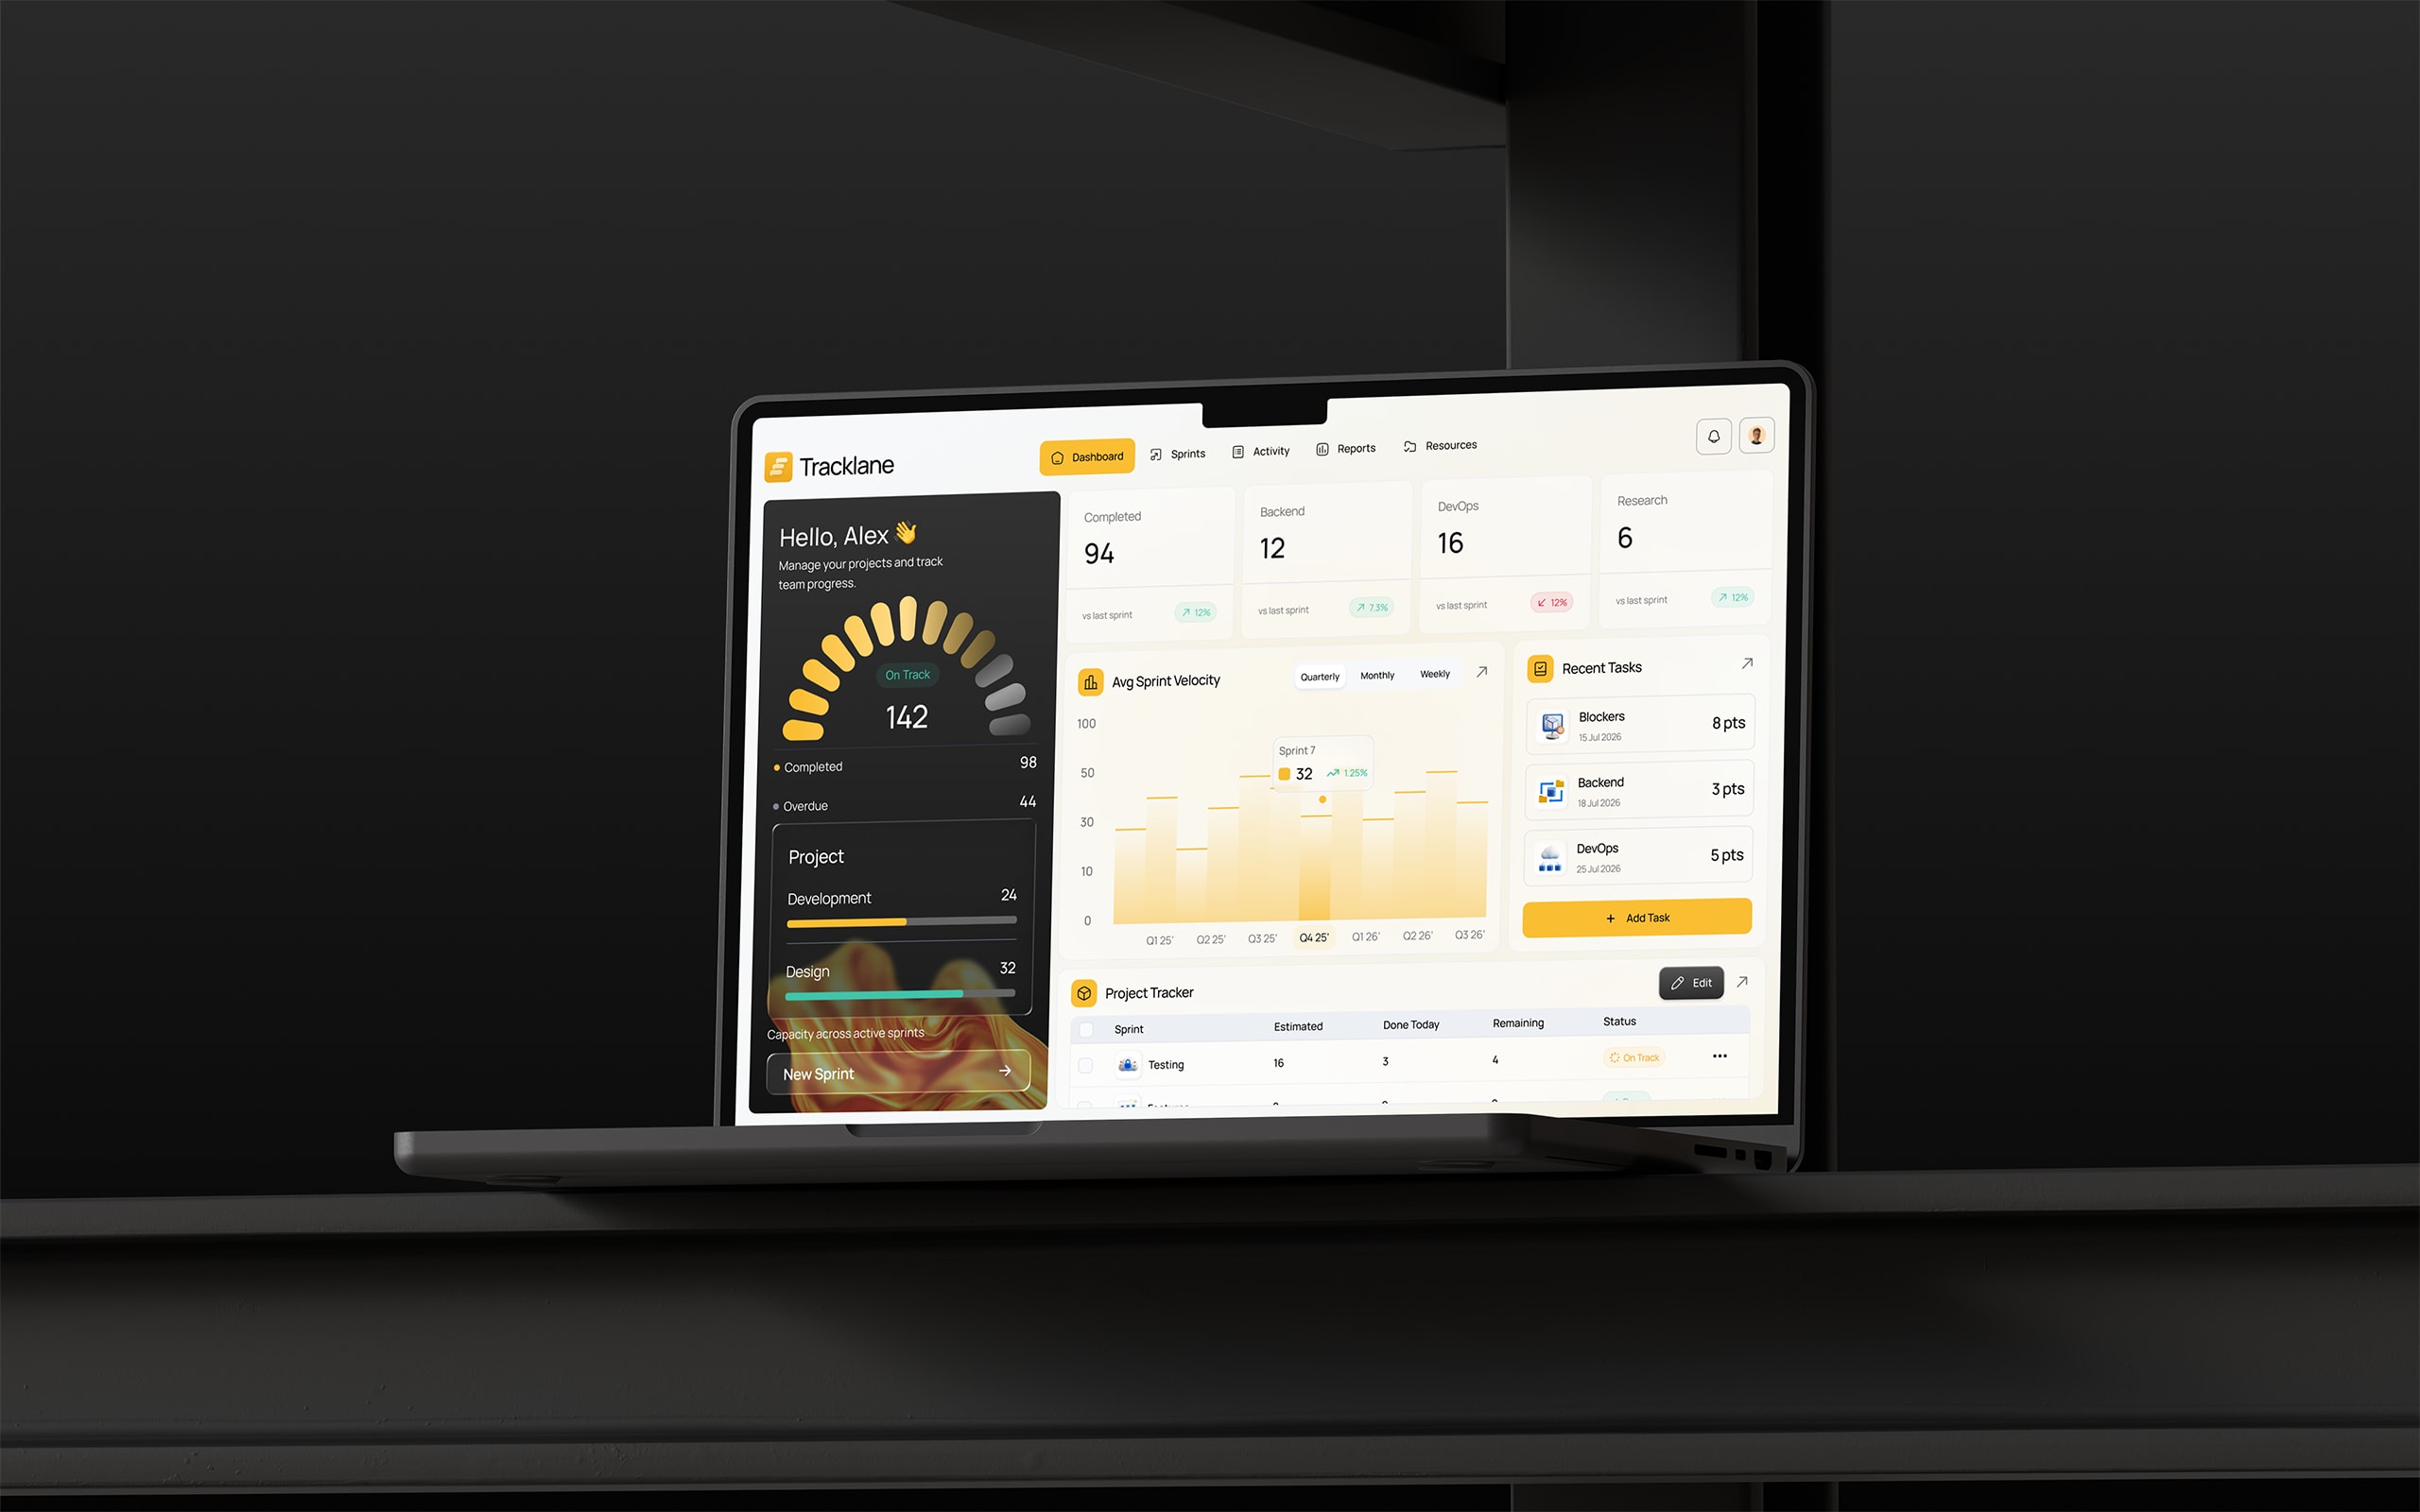
Tracklane — project management dashboard
Overview
Tracklane is a project management platform built for fast-moving product teams. It gives engineering leads, designers, and project managers a single dashboard to track sprint health, team workload, task status, and delivery velocity — without the overhead of enterprise PM tools.
The founding team approached LevelByte with a clear vision: replace a patchwork of spreadsheets, Notion boards, and Slack threads with one purpose-built tool that could manage sprints, track deadlines, and surface blockers before they derail delivery. They needed it production-ready in under 10 weeks.
Over ten weeks we took Tracklane from concept to launch: data modelling, UX design, frontend and backend development, real-time WebSocket updates, and deployment on edge-optimised infrastructure — delivering a platform that shipped with 24 active projects across two teams and zero missed sprints in its first month.
The Challenge
Before partnering with LevelByte, the Tracklane team had validated demand through internal pilots at two product companies. But the jump from manual tracking to a reliable, multi-team platform exposed critical gaps that were blocking adoption.
Fragmented tooling
Sprint planning lived in spreadsheets, task tracking in Notion, and status updates in Slack threads — meaning no single source of truth existed for project health, and blockers went unnoticed until standup meetings.
No velocity visibility
There was no way to measure sprint velocity, compare planned vs delivered work, or forecast capacity — making sprint planning a guessing game every two weeks.
Manual activity tracking
Logging hours, updating task status, and generating reports required manual effort across multiple tools — creating a 30-minute daily overhead per team lead that could be eliminated with automation.
Team scaling bottleneck
The existing workflow couldn’t support multiple concurrent teams. Adding a new squad meant duplicating entire spreadsheet structures and losing cross-team visibility.
Project Timeline
Shadowed sprint ceremonies at two pilot product companies, audited the existing spreadsheet + Notion + Slack stack, and locked the data model (Team, Project, Sprint, Task, Activity) against real backlogs.
Sprint plan, competitive audit of 4 PM tools, the real-time WebSocket architecture, and the two-week release cadence with continuous deployment so the founding team could demo working software every Friday.
Wireframes for all 5 core screens (dashboard, sprint view, activity log, reports, resources) validated against real sprint data — including edge cases like blocked tasks rolling sprints and team members with zero logged hours.
The product itself: sprint dashboard with velocity tracking, activity log with hourly breakdowns, velocity/capacity reports, team workload view, and the task engine with the Blocked → In Review → Done status workflow.
Load tested with 500+ simulated concurrent users, sprint-transition edge-case QA, regression coverage across all 5 screens, role-based access security review, and mobile/tablet responsive validation.
Production deploy on Vercel’s edge network with Redis-backed WebSocket channels, Sentry monitoring, real-time uptime alerting, and the 7-day post-launch bug warranty window.
Key Features Delivered
Technology Stack
Each layer chosen for the way it serves the product \u2014 not the trend cycle.
Frontend
Server-rendered React on Next.js with edge-cached shells, so sprint dashboards paint sub-second even when team leads check between standups.
Realtime backend
Typed API routes with Prisma as the single source of truth for the schema, plus WebSocket channels so task status changes propagate to every open dashboard instantly.
Data & storage
PostgreSQL with row-level security holds the relational sprint and activity data. Pre-computed velocity queries keep the reports view fast under load.
Ops & insight
Reproducible Docker deploys for every environment plus Sentry from launch — so production issues are caught before the next standup, not from a bug ticket.
Results & Impact
Ten weeks from spreadsheets to a real-time sprint platform — here is what landed inside the team’s workflow.
Design & Development Highlights
 01 · HighlightUX
Wireframing & UX Strategy
We structured the product around five core workflows: monitoring (dashboard), planning (sprint view), tracking (activity log), analysing (reports), and managing (resources). Each flow was wireframed as a complete journey and validated against real sprint data from the client’s existing workflow — including edge cases like blocked tasks rolling across sprints and team members with zero logged hours. This ensured the UI wasn’t designed for hypothetical scenarios but for actual operational patterns.
- 5 core workflows mapped end-to-end: monitor, plan, track, analyse, manage
- Validated against real sprint data — not theoretical scenarios
- Edge cases like blocked tasks and zero-hour users designed for upfront
Final Thoughts
Tracklane demonstrates that a purpose-built project management tool can be designed, built, and shipped in ten weeks without cutting corners. From sprint velocity tracking to real-time activity logging to team workload dashboards — every feature was delivered production-ready.
By combining Supabase’s real-time capabilities with Redis-backed WebSocket channels and Vercel’s edge deployment, we built an infrastructure that tracked 862 story points across 24 active projects in its first sprint with sub-second dashboard loads and 99.4% uptime. The platform launched with two active teams and has already onboarded a third.
This project is a case study in what’s possible when product thinking meets engineering discipline. No shortcuts, no throwaway code — just a clean, well-architected system designed to grow with the team.
More Work
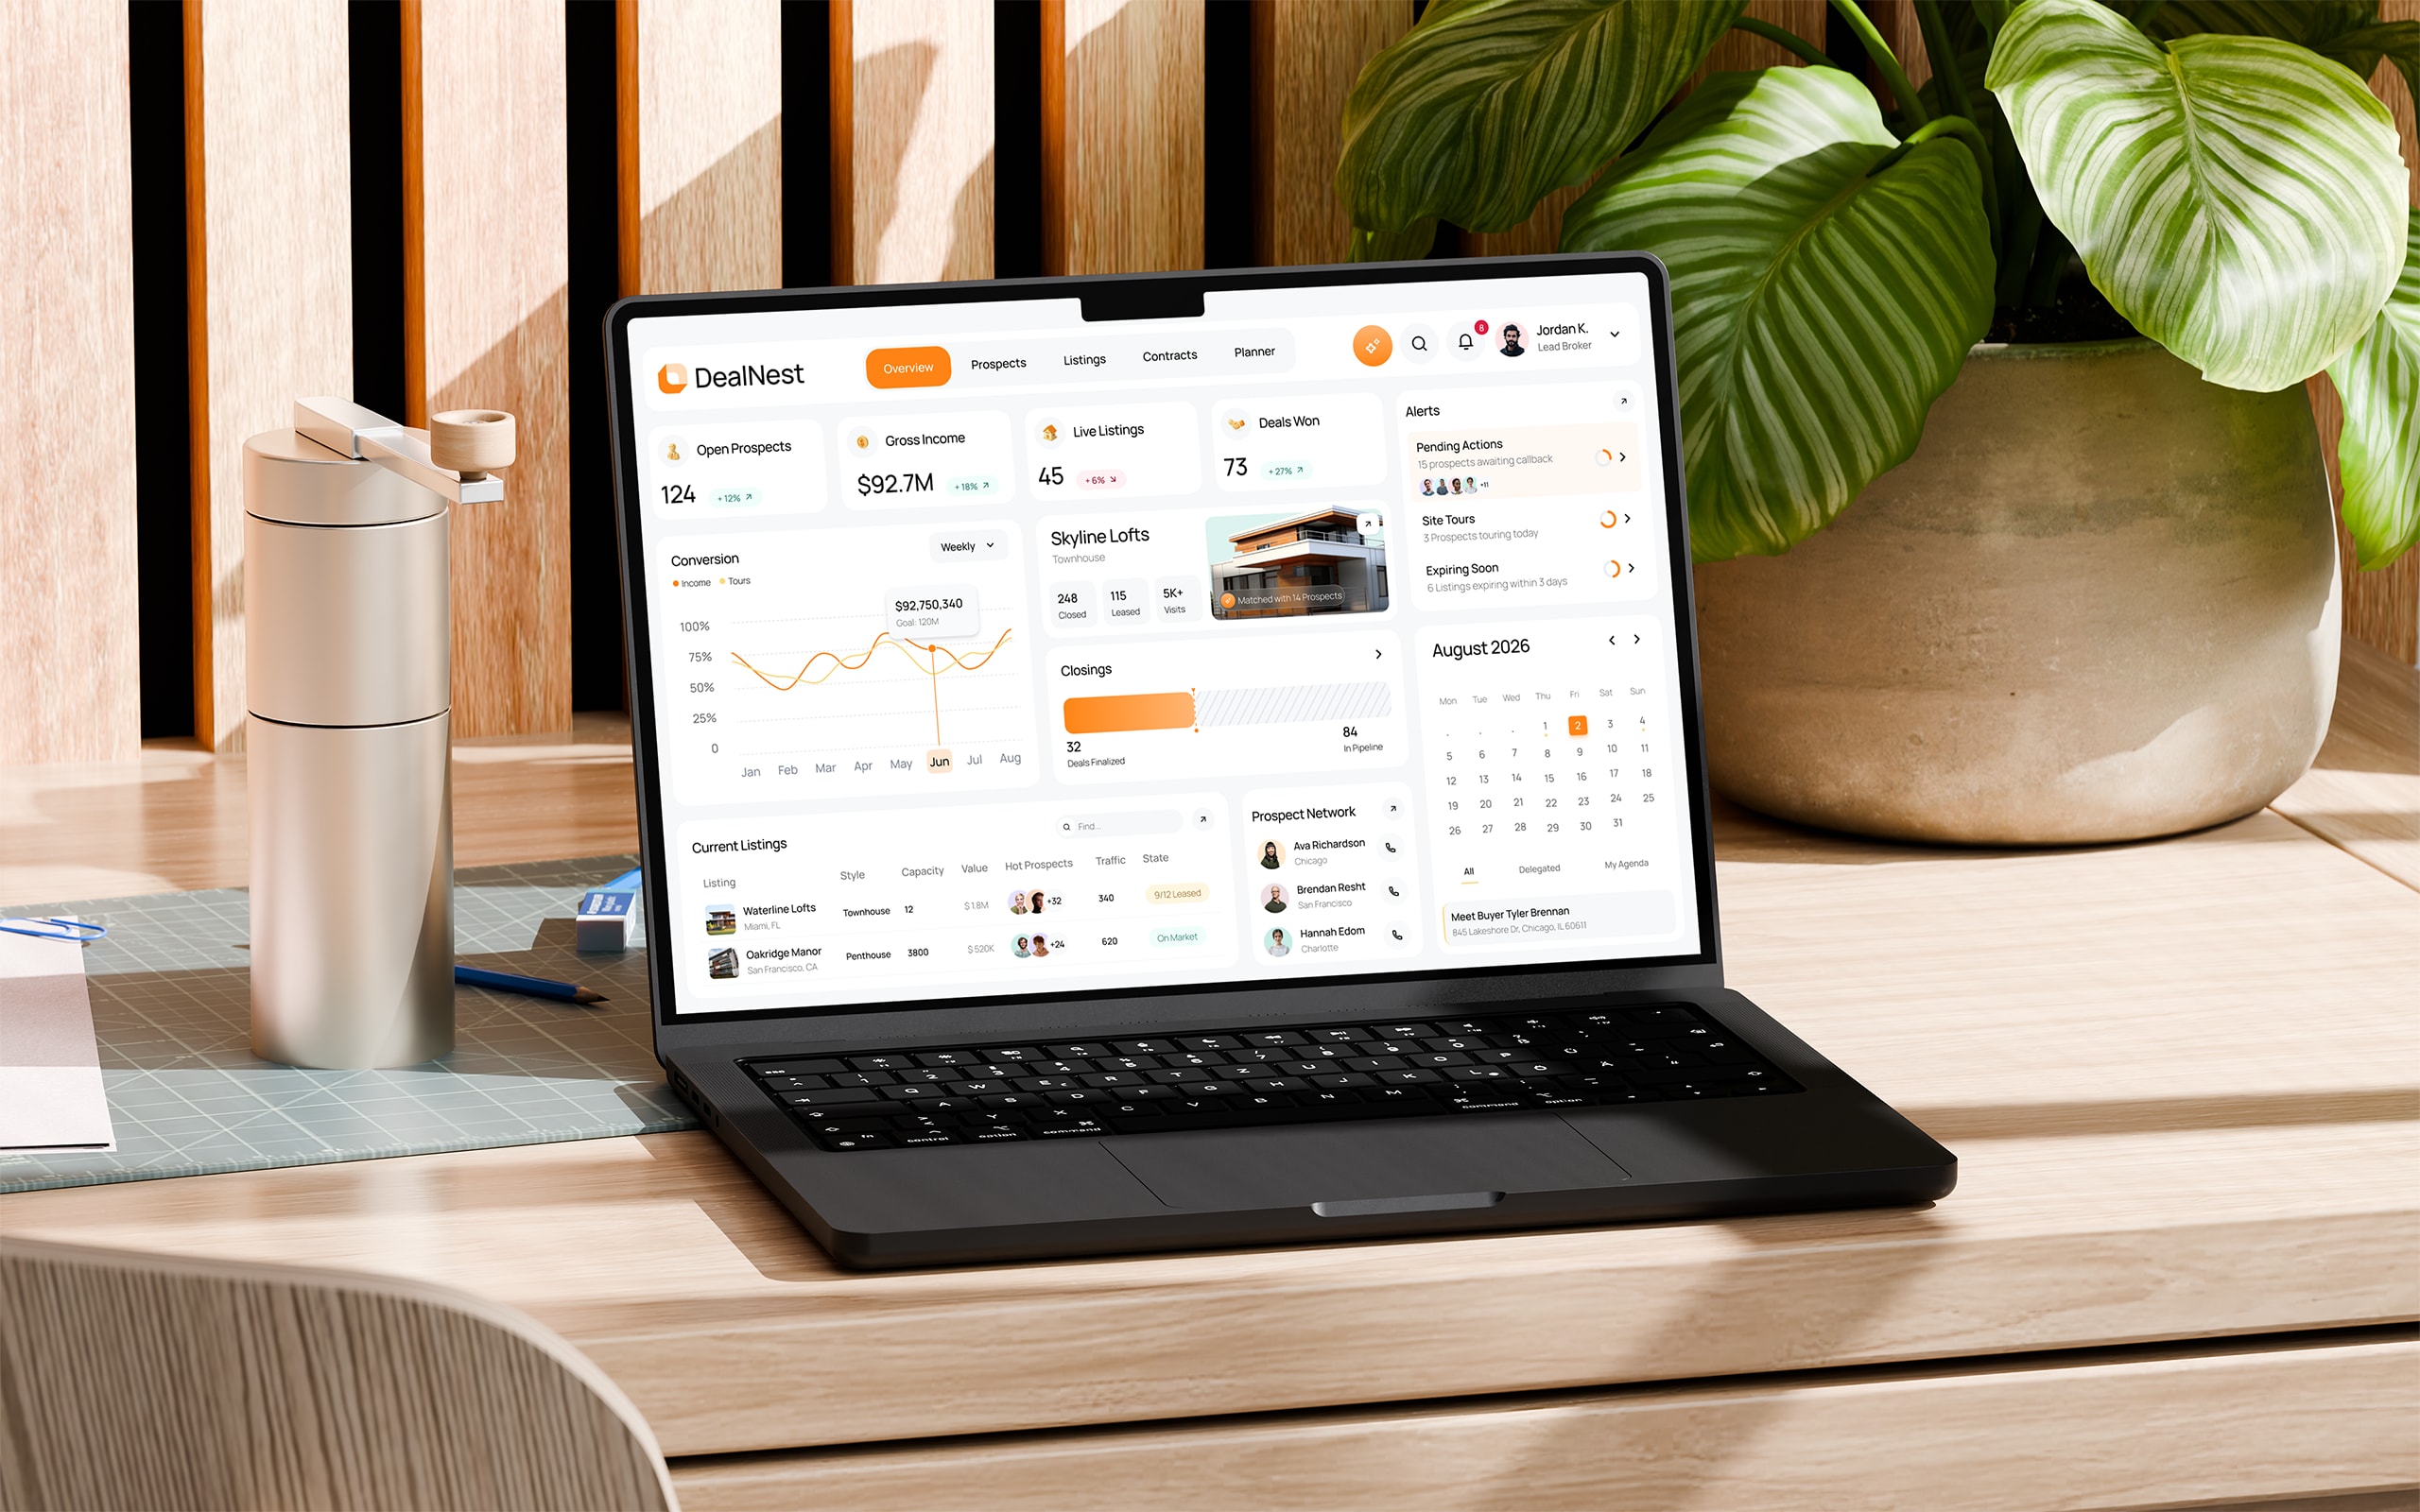 Real Estate / CRM9 weeks
DealNest
DealNest is a CRM platform purpose-built for real estate brokerages and independent agents. It consolidates prospect tracking, property listings, calendar scheduling, document management, and revenue analytics into a single dashboard — replacing the disconnected spreadsheets and generic CRMs that most agencies struggle with.
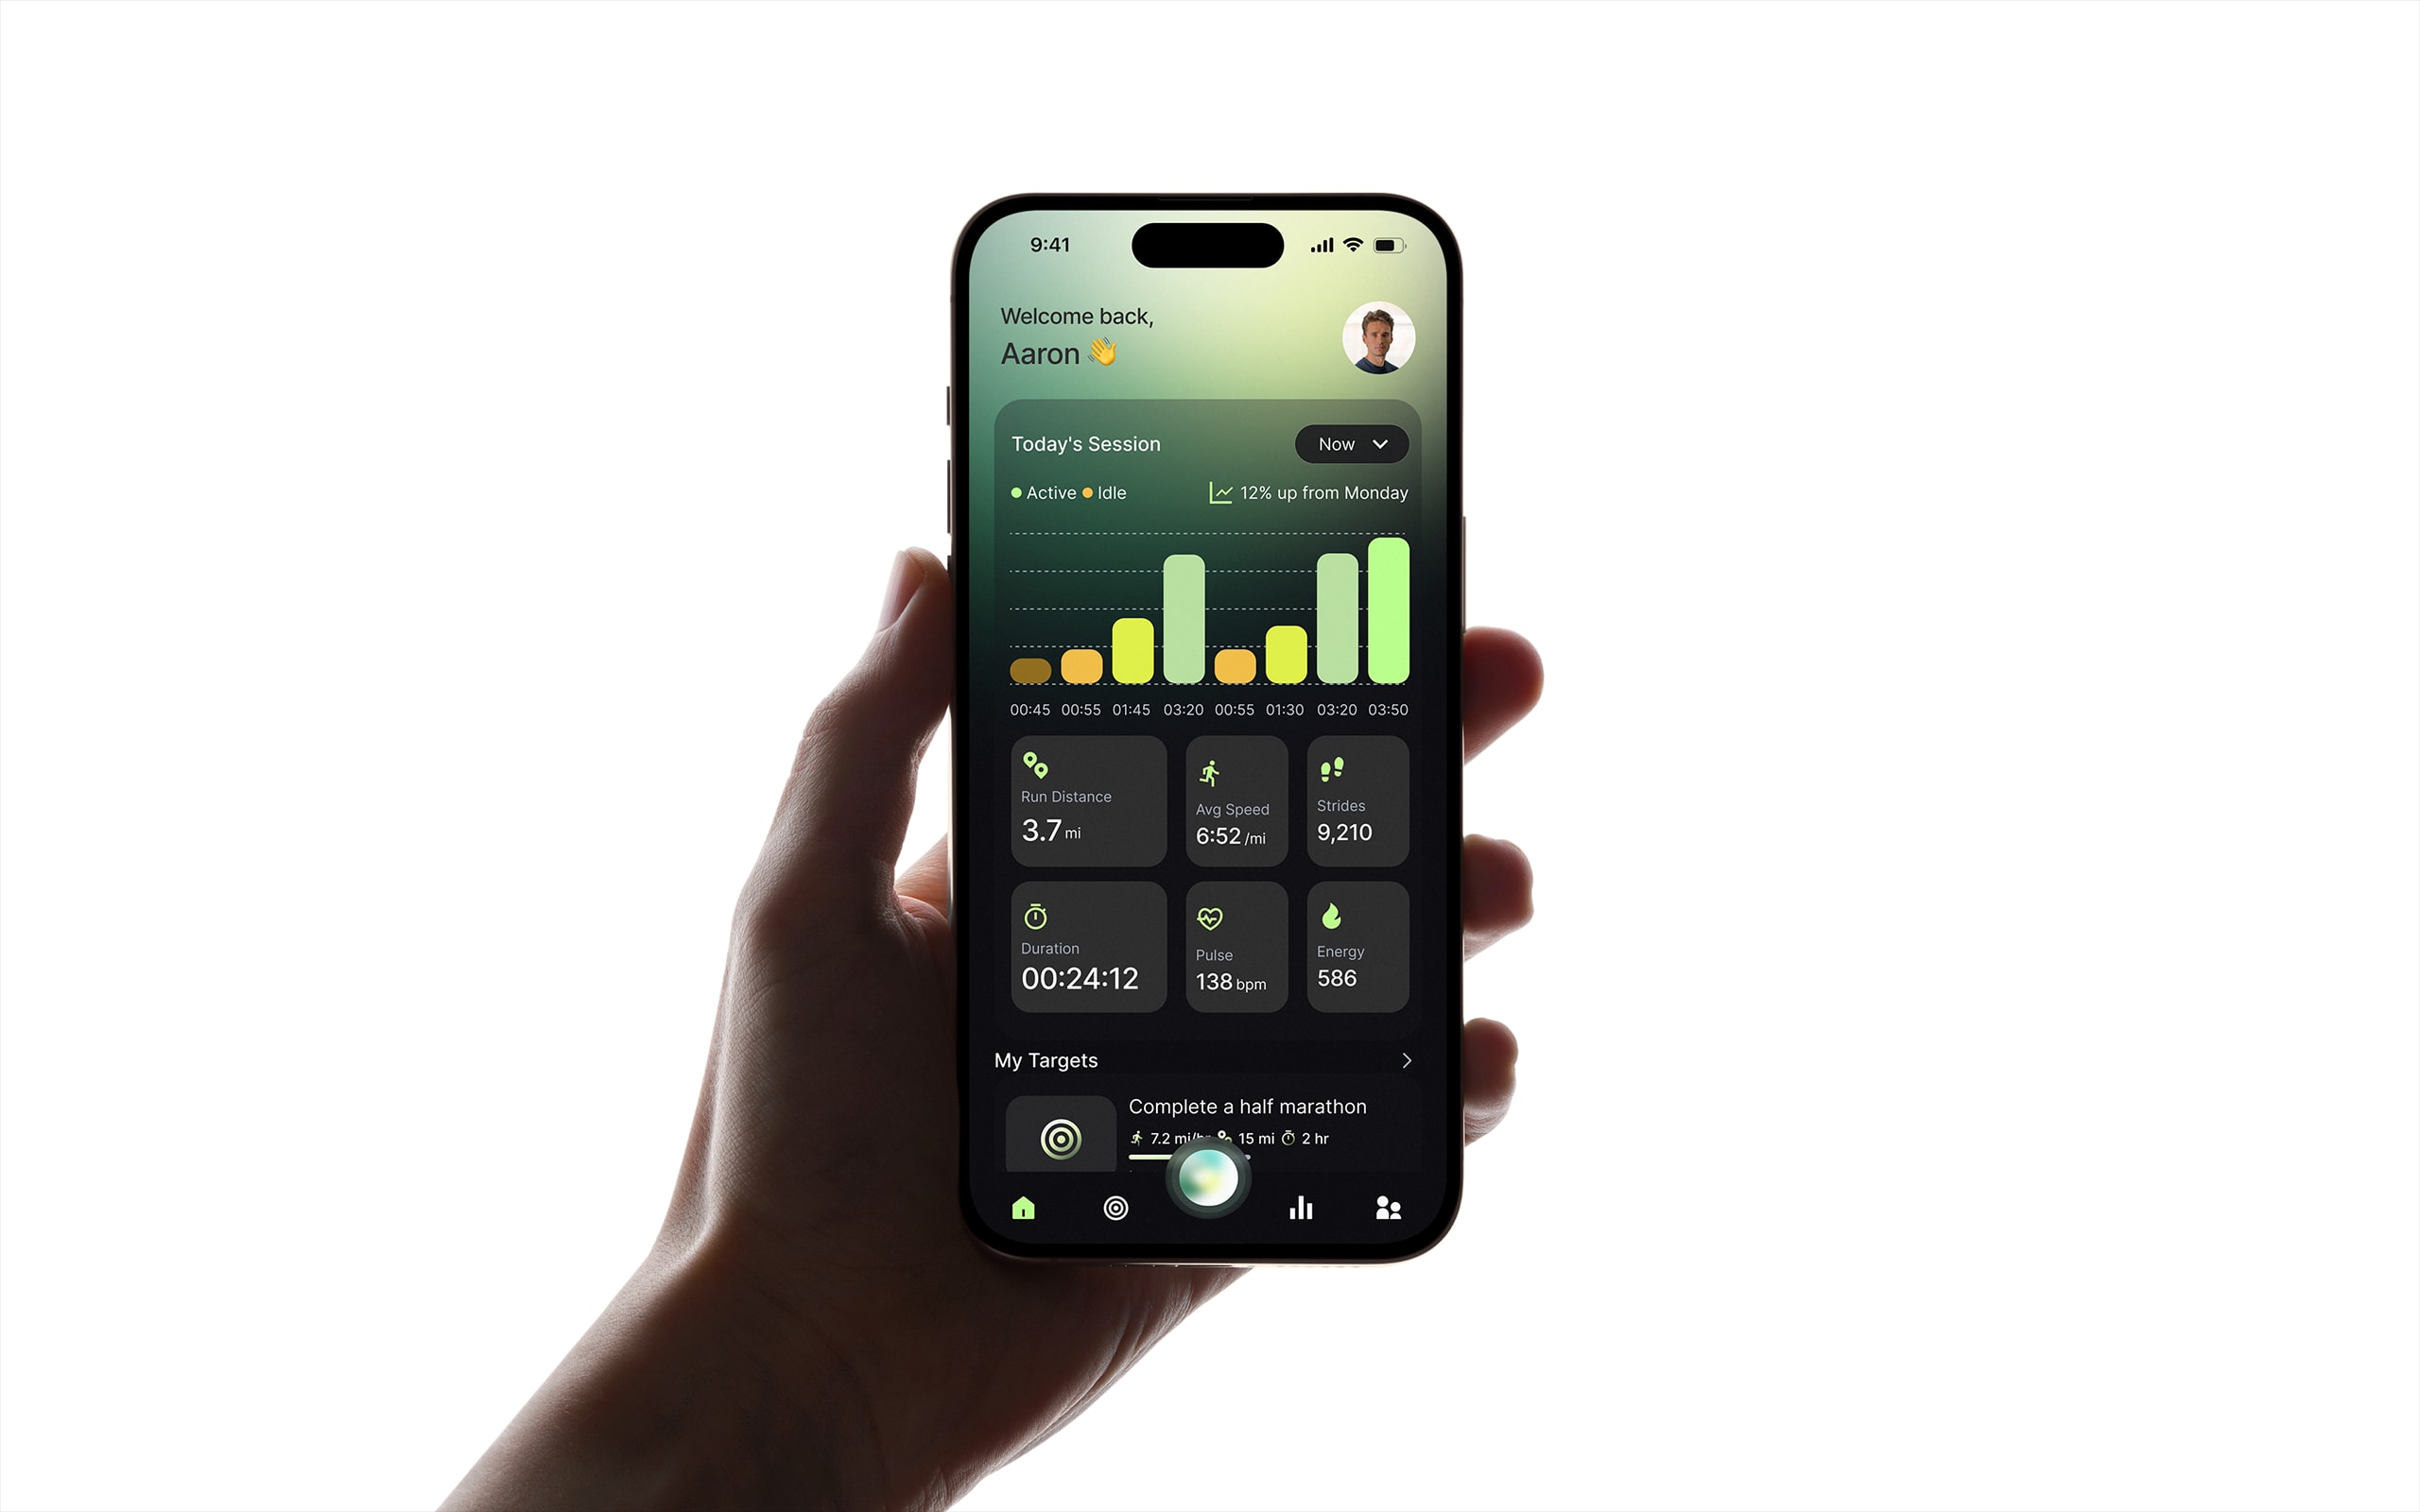 Health & Fitness / Mobile10 weeks
Stride
Stride is an AI-powered fitness and running companion built for everyday runners who want smarter training without the complexity of professional coaching apps. It combines live GPS tracking, real-time pace analytics, goal management, and a built-in AI coach that adapts training plans to each runner’s history, body metrics, and personal targets — all inside a clean, native mobile experience.
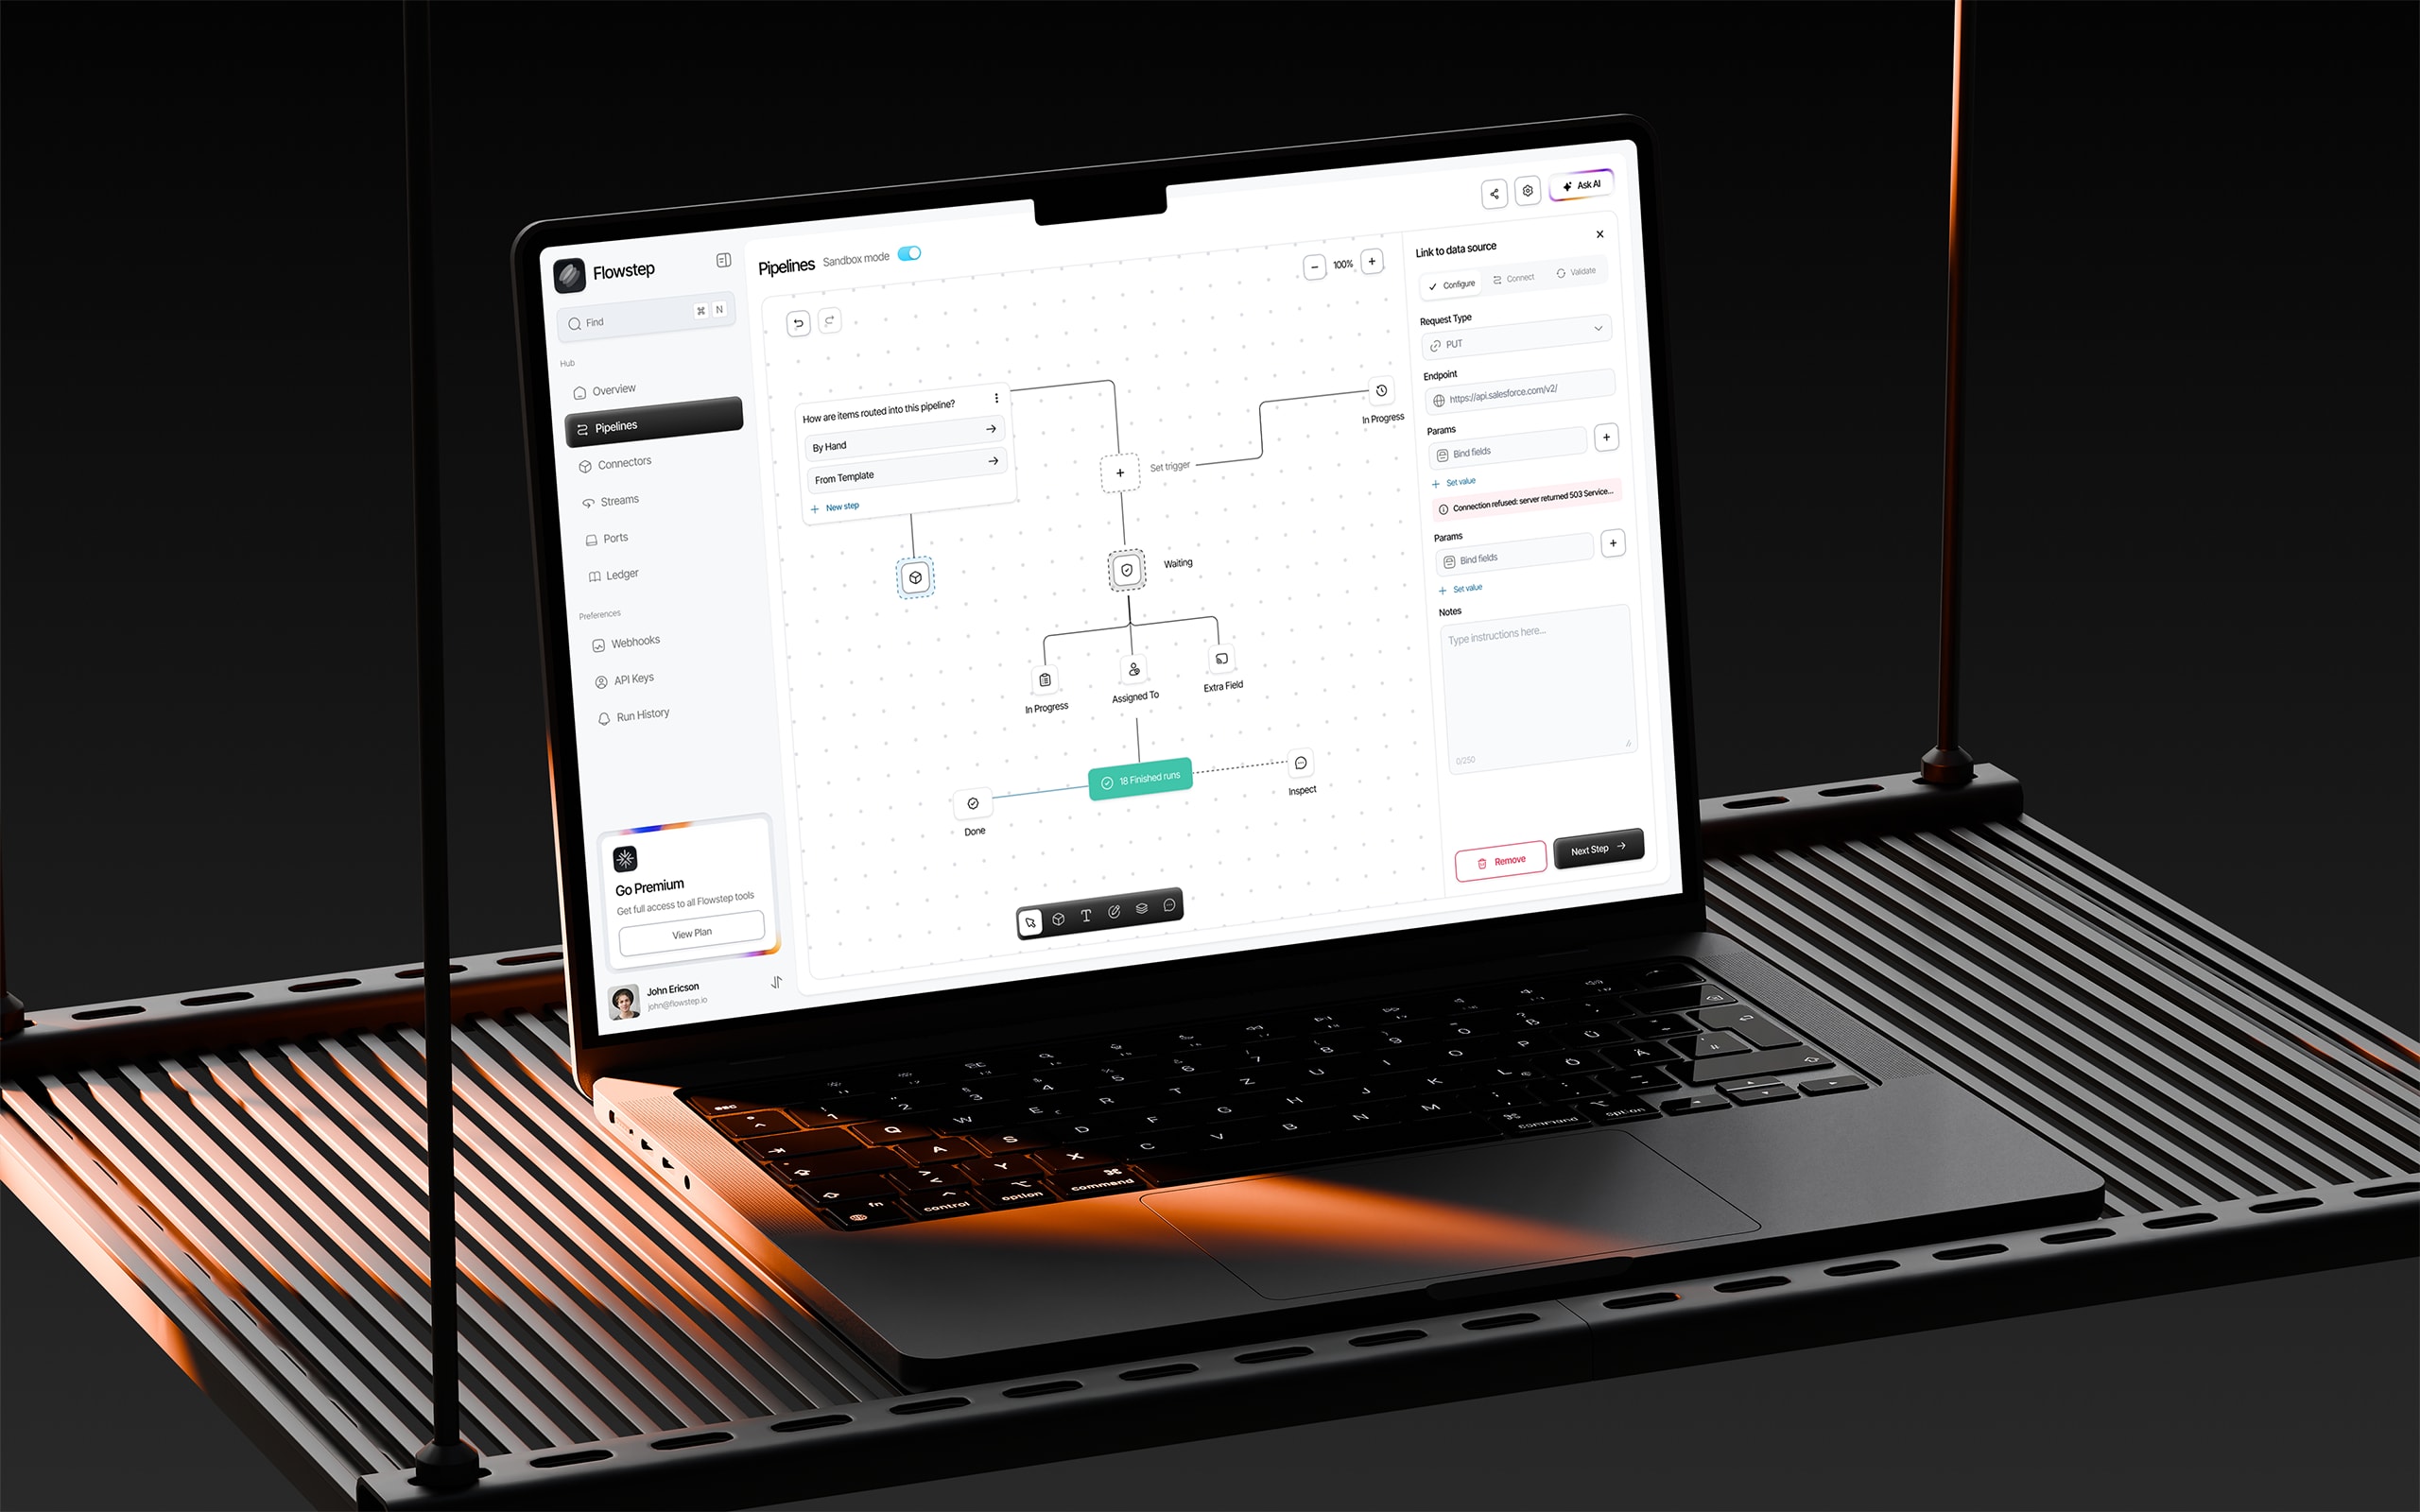 SaaS / Workflow Automation8 weeks
Flowstep
Flowstep is a workflow automation platform that lets teams connect their favourite tools — Jira, Slack, Mailchimp, Intercom, and dozens more — into programmable pipelines that run on autopilot. Instead of switching between tabs and copying data by hand, users wire up triggers, steps, and connectors in a visual builder, then let the system handle the rest.